Easiest and Hardest Places in the UK to Renovate

Improve or move? Study Reveals the Easiest and Hardest Places in the UK to Renovate
Brits are facing a time of economic uncertainty, especially when it comes to skyrocketing mortgage rates, high property prices and energy bills. So it’s hardly surprising that an increasing number are choosing to stay put and improve their current homes rather than move to new houses.
Google searches in the UK for ‘extension’ and ‘renovation’ both increased by 22% over 2023 vs 2022, suggesting an increase of prospective house renovations in the coming months.
But where in the UK are the easiest and hardest places to get permission to extend or alter your property?
At Homeprotect, we’ve conducted the following study into 308 councils to assess planning permission practices between 2013-2023, to determine where in the country benefits from the smoothest approval process for extending or renovating a house.
Where is the easiest place to renovate in the UK?
With a range of external factors responsible for causing long wait times on planning permission, it might be more difficult to do those home improvements than you first hoped…
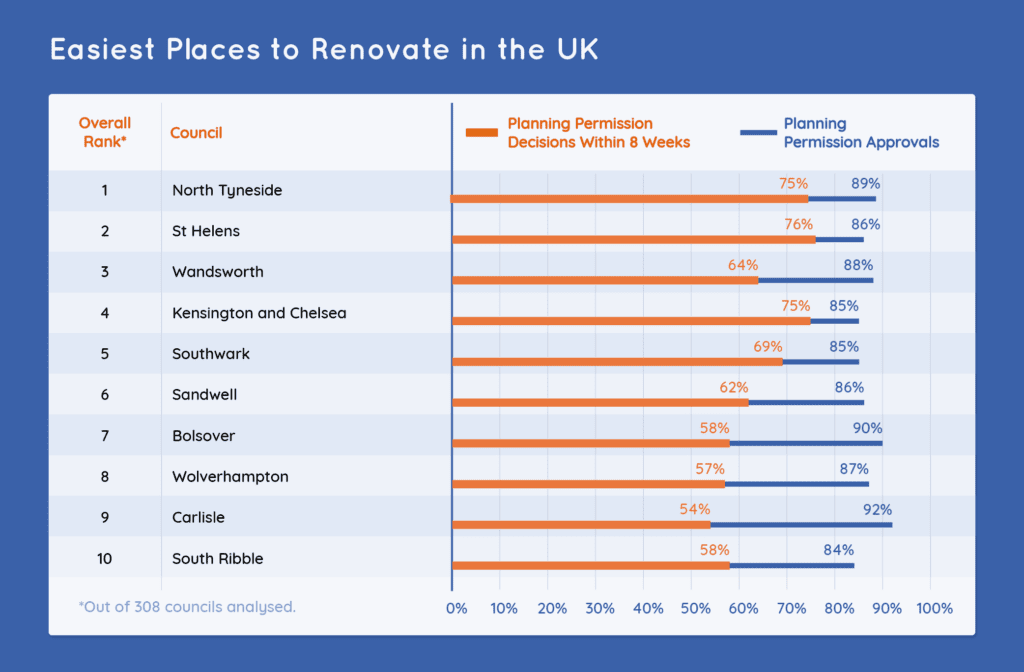
By comparing planning permission approval rates and decision speeds between 2013-2023, we can crown the UK’s renovation capital.
We have ranked all the 308 councils we studied, to crown the following our winners who have had the smoothest planning permission processes in the last decade:
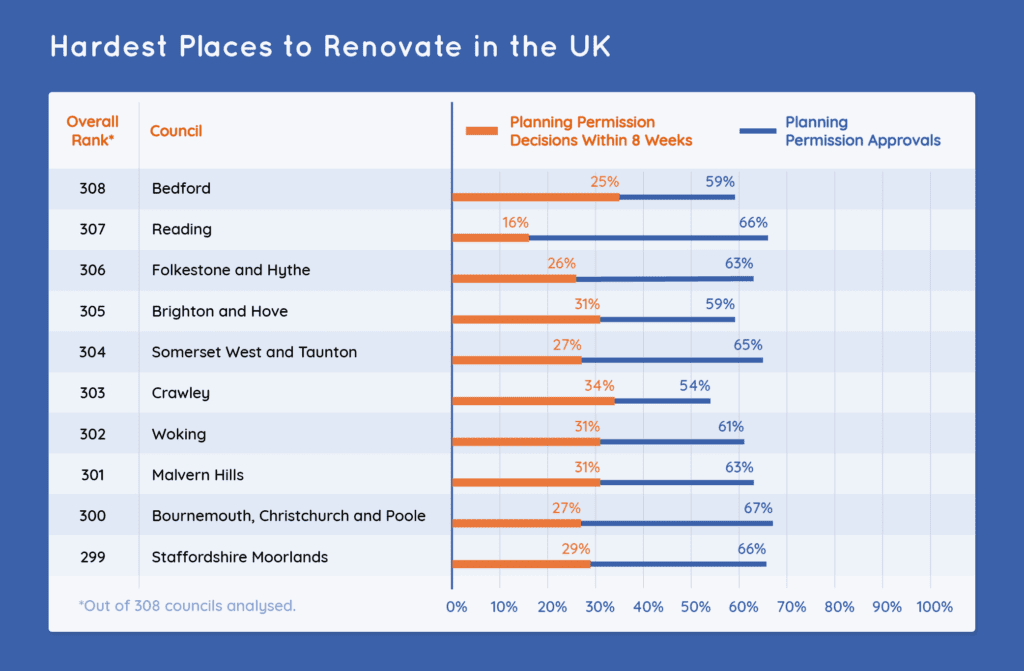
Using the same metrics, we can also examine the areas where homeowners might struggle to get extensions and alterations approved:
Which UK councils are the most and least efficient with granting planning permission?
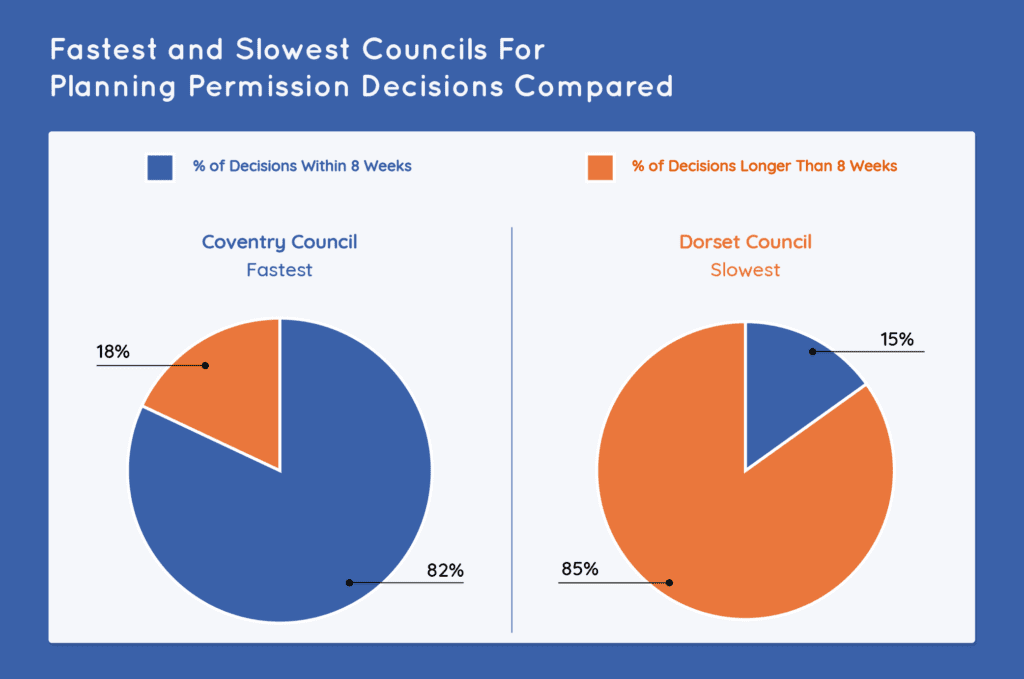
Using government data, we can see which councils were most efficient with making decisions on planning permission for ‘minor dwellings’, which are mostly residential houses:
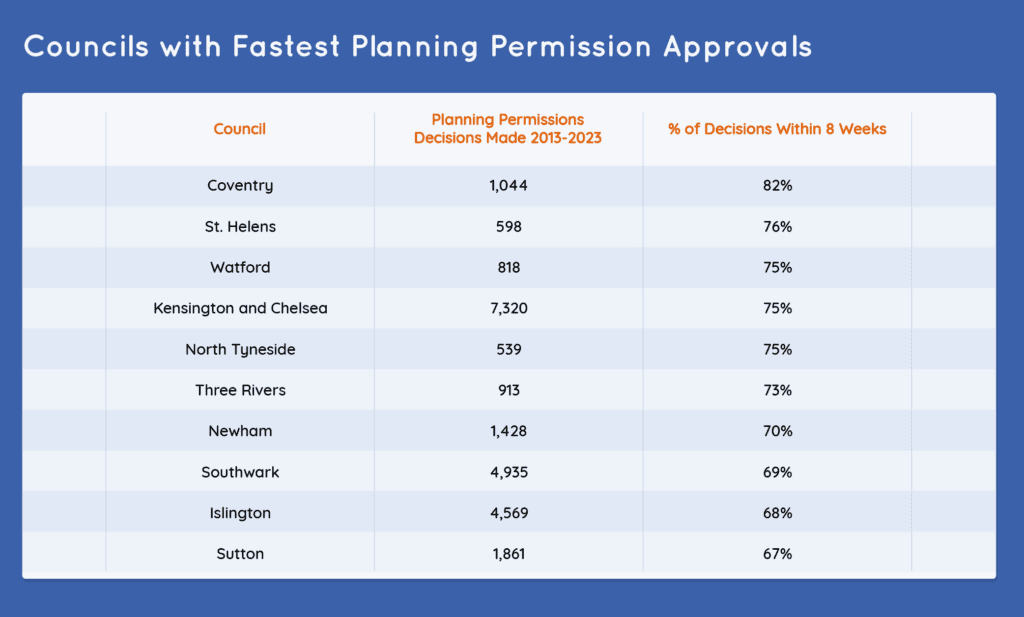
As we can see, while there are several London councils featured in the top 10, Coventry takes the crown with an impressive 82% of decisions made within 8 weeks.
The bottom 10 feature several councils that have had under 1,000 planning applications to decide over the last 10 years. It’s important to remember that slow decision making in some areas might be reflective of more stringent inspection processes, or areas with a higher proportion of structures with historical significance.
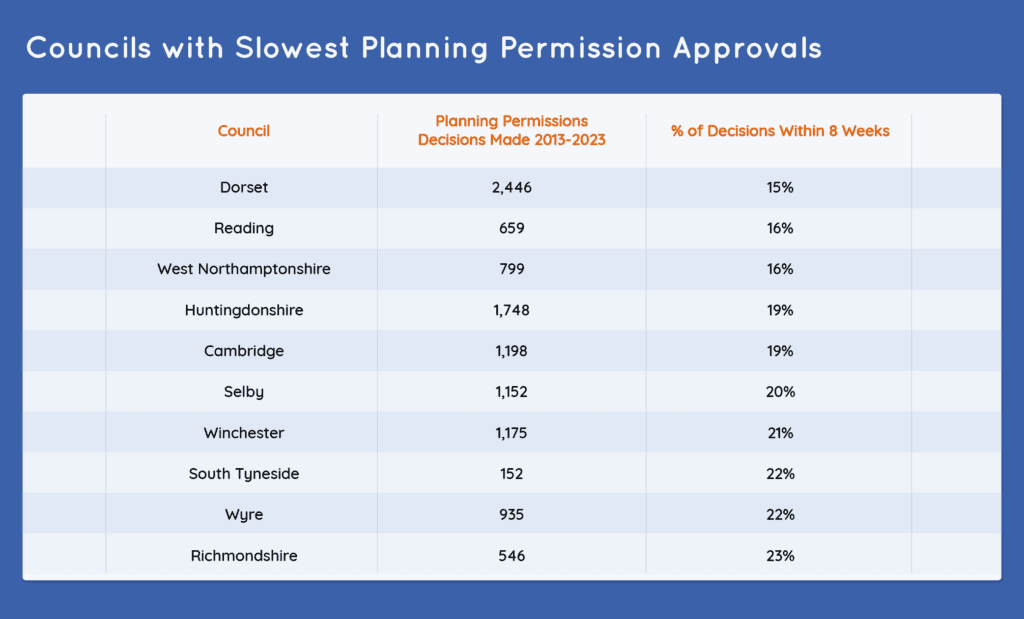
Comparing councils for their approval speeds reveals the difference your postcode could make to the speed at which you can progress a project to revamp your home:
Where in the UK are you most likely to be approved for a planning permission request?
Getting a quick decision on your proposed property changes is one thing, but when permission is declined this can throw a spanner in the works.
We looked at the councils that had the highest approval rates for planning applications in the last ten years, and the most accepting councils are approving almost 90% of requests:
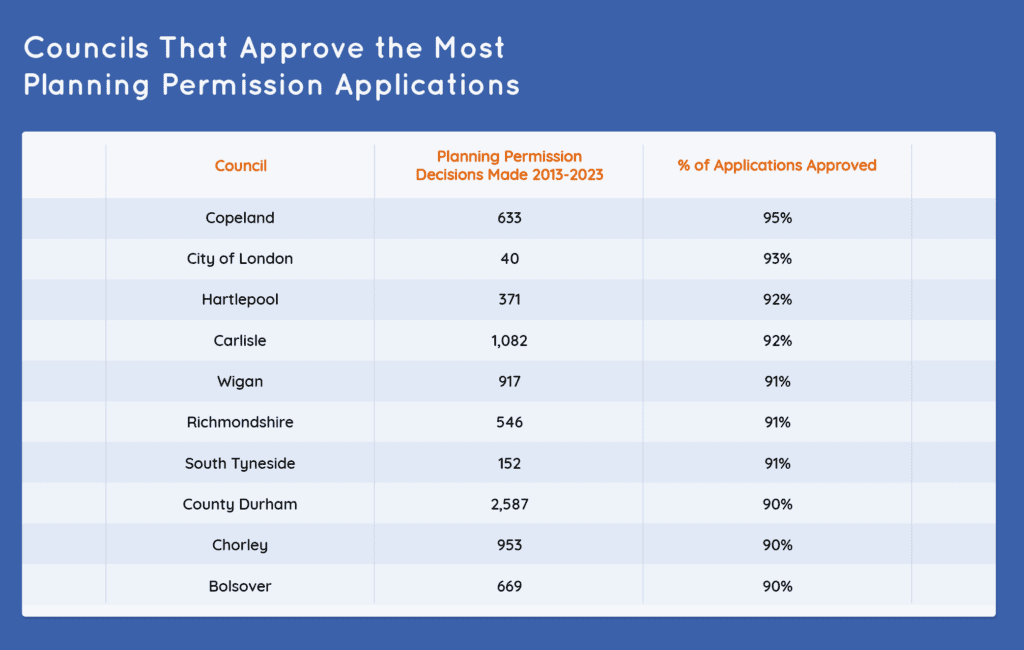
It’s worth noting Copeland Borough Council was abolished and became part of Cumberland unitary authority in April 2023, though this data applies to the decade of 2013-2023.
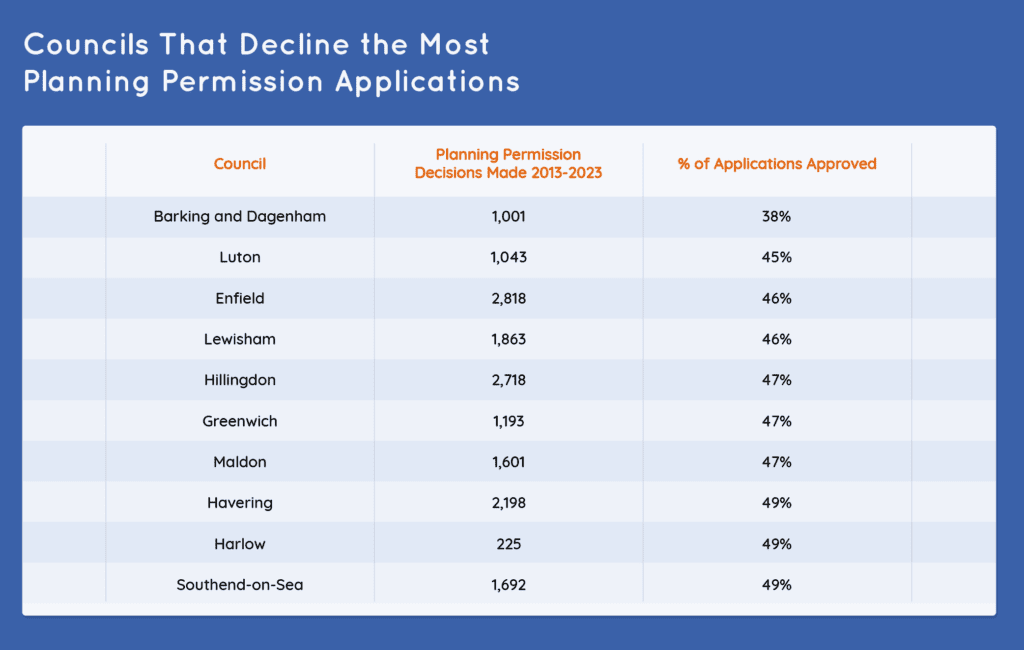
Again, we can also assess areas where approvals are less likely. At the bottom of our list are some councils that decline the majority of proposals they receive:
Let’s now explore some of the other considerations you might want to make when debating between extending your existing house, or moving to somewhere else:
Where is the most affordable housing in the UK?
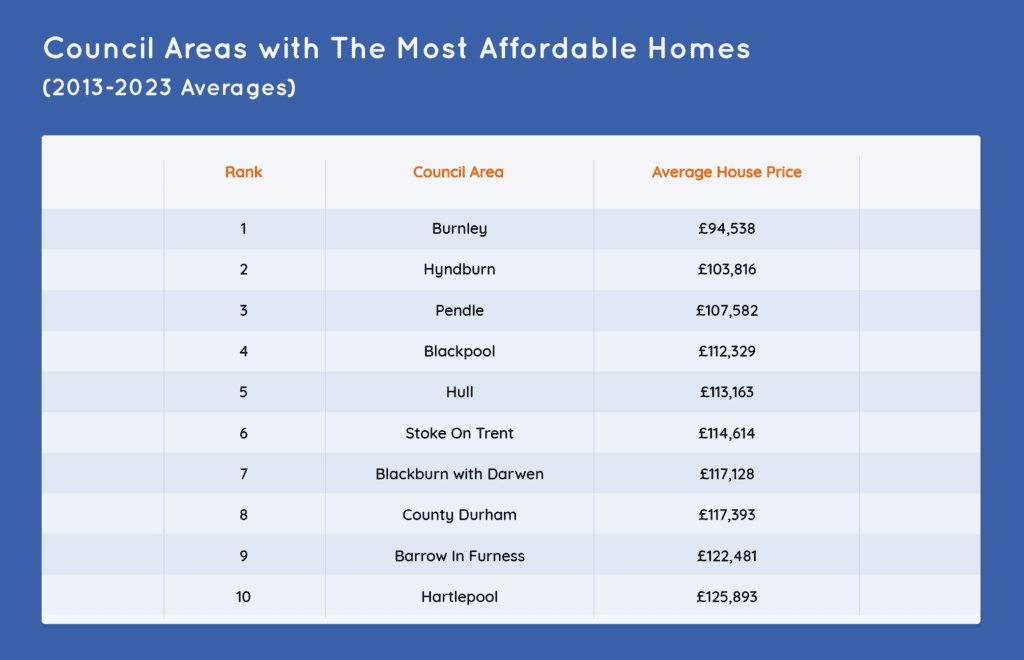
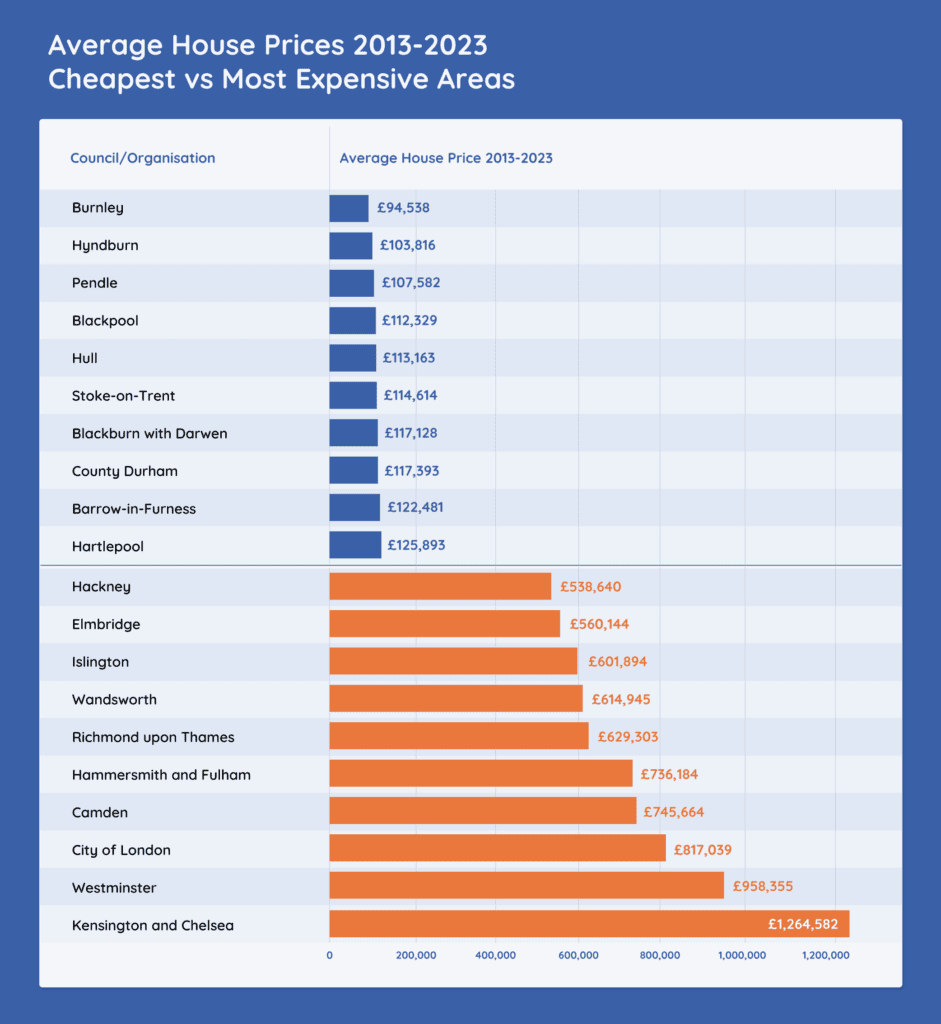
The cost of housing in your surrounding area might play a role in your decision to stay put and improve the home you already own rather than moving.
It’s no surprise that the most expensive council areas are mostly based in London, but the cheapest areas are much more spaced out:
Which council areas see the most house moves?
By looking at:
- The average number of houses sold in each area per year
- The number of houses that currently pay council tax in each area
We can approximate the proportion of houses that have been sold in an average year over the last decade. This helps us understand which parts of the country you’re more likely to see ‘for sale’ signs and changing neighbours.
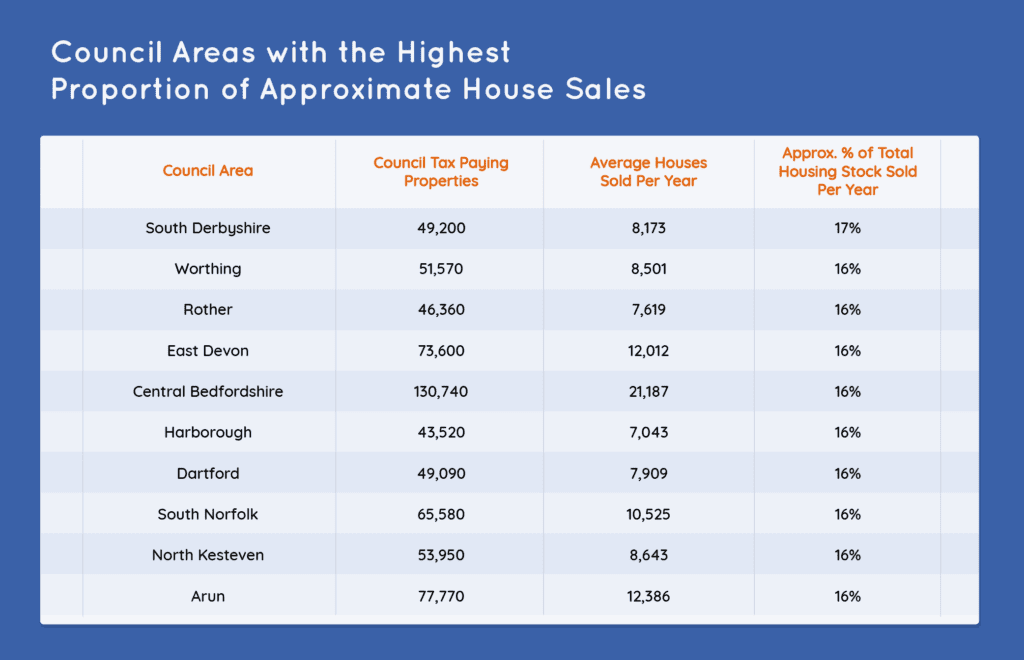
Areas with less sales would suggest happier homeowners who are more likely to want to develop what they have:
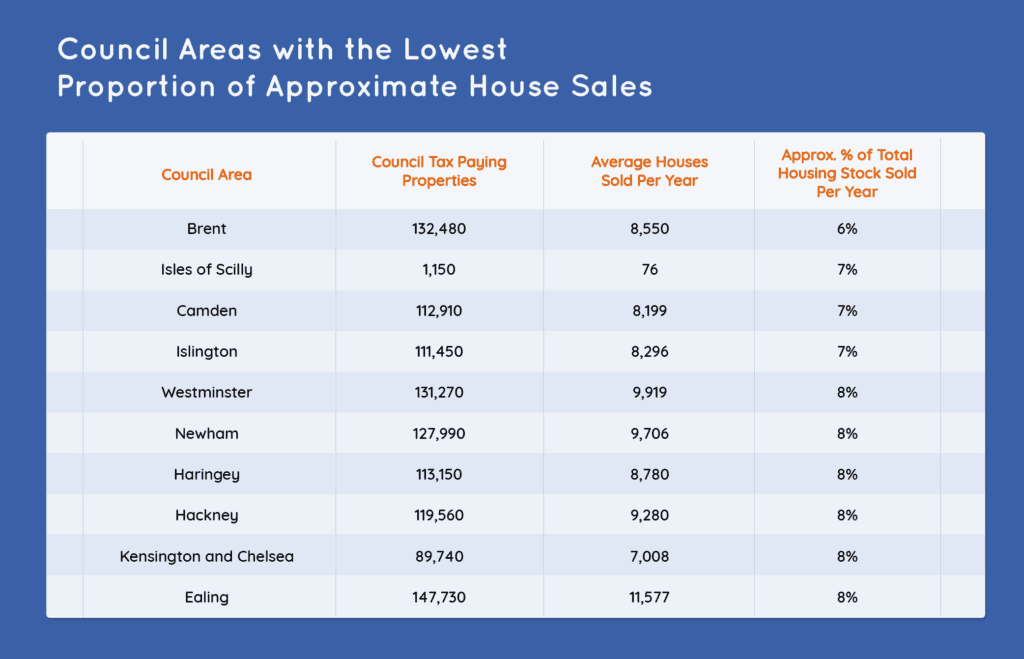
One interesting note is how a lot of the houses featured in our ‘least properties sold’ table are also the least affordable council areas.
Generally, we can see that in rural areas people are more likely to move around. In London more homeowners stick around rather than selling up, which might be a reaction to high house prices in the capital.
Conclusions
Whether you’re dreaming of expanding your existing home, or more committed to moving into a larger house, we hope this research has been insightful.
The people of North Tyneside can sleep easy though, knowing that statistically they’re more likely to enjoy a smoother planning application process compared to anyone else in the country.
Methodology
Sources:
House Prices:
https://www.ons.gov.uk/peoplepopulationandcommunity/housing
We took the average house sale price based off sale prices in each year between 2013 to 2023.
Number of Residential Houses Sold:
https://www.ons.gov.uk/peoplepopulationandcommunity/housing
Number of Properties Paying Council Tax:
https://www.gov.uk/government/statistics/council-tax-stock-of-properties-2023
https://assets.publishing.service.gov.uk/media/6486ff31103ca6000c039cd7
Planning Permission Data:
https://www.gov.uk/government/statistical-data-sets/
(District Planning Application Statistics (PS2) – full dataset)
We used the data from 2013 to 2023 to assess performance over the last 10 years.
The following councils and planning permission authorities were omitted from our study because we had insufficient data to make fair comparisons with them:
- Aylesbury Vale
- Bournemouth
- Broads Authority
- Chiltern
- Christchurch
- Corby
- Cumberland
- Dartmoor National Park
- Daventry
- East Dorset
- East Northamptonshire
- Ebbsfleet Development Corporation
- Exmoor National Park
- Forest Heath
- Hartlepool Development Corporation
- Kettering
- King’s Lynn and West Norfolk
- Lake District National Park
- London Legacy Development Corporation
- Middlesbrough Development Corporation
- New Forest National Park
- North Dorset
- North York Moors National Park
- North Yorkshire
- Northampton
- Northumberland National Park
- Old Oak and Park Royal Development Corporation
- Peak District National Park
- Poole
- Purbeck
- Shepway
- Somerset
- South Bucks
- South Downs National Park
- South Northamptonshire
- St Edmundsbury
- Suffolk Coastal
- Taunton Deane
- The Broads Authority
- Waveney
- Wellingborough
- West Dorset
- West Somerset
- Westmorland and Furness
- Weymouth and Portland
- Wycombe
- Yorkshire Dales National Park
- Bridgend
- Caerphilly
- Wrexham
- Vale of Glamorgan
- Torfaen
- Swansea
- Rhondda Cynon Taf
- Powys
- Pembrokeshire
- Newport
- Monmouthshire
- Neath Port Talbot
- Merthyr Tydfil
- King’s Lynn and West Norfolk
- Isle of Anglesey
- Gwynedd
- Flintshire
- Denbighshire
- Conwy
- Ceredigion
- Carmarthenshire
- Cardiff
- Blaenau Gwent
In some instances, these councils are now defunct, or have merged with other councils which are represented in the data. We used the original government statistics in some circumstances, for example Bournemouth Council was replaced by Bournemouth, Christchurch and Poole Council in 2019 – we have assumed that the Government data for ‘Bournemouth, Christchurch and Poole Council’ also includes historic data for the other ex-councils.
Copeland Borough Council has been included in our analysis. It was abolished and became part of Cumberland unitary authority in April 2023, though our data applies to the decade of 2013-2023.
We excluded national parks and other planning authorities that were not classed as councils in order to keep the comparison relevant to different geographic areas.
‘Average Houses Sold Per Year’ was calculated by using the total for 2013-2023, and then dividing that number by 10. ‘Approx. % of Total Housing Stock Sold Per Year’ was then calculated by comparing this figure to the total number of properties listed as paying council tax in 2023. This might result in some anomalies in the data if any particular council saw a large influx in new build homes in recent years, but we believe this is the fairest way to compare average yearly house sales over the last decade with the approximate stock of total housing.
All planning permission data in this study refers to ‘minor dwellings’ specifically.
For our overall winners we ranked each council by how quickly they made planning permission decisions, and separately by how likely they were to approve planning permission requests. We then combined these rankings to work out which councils had the best blend of both speed and likeliness of approval when it comes to planning permission applications.
