

What are England and Wales’ Riskiest Postcodes?


Looking to move, or buy your first home? It’s essential to check for risks that may not be immediately apparent or flagged during the buying process.
A research study by Homeprotect found that over 153,000 properties have been sold in the UK’s top 10 riskiest postcodes since 2023, while over 271,000 homes were purchased in high flood risk areas.
Using the Homeprotect risk calculator, which was built using proprietary risk data for homes across the UK, we analysed every postcode in England and Wales, assigning a score from one to five (with five indicating the highest possible risk) across several risk categories:
Notably, all postcode areas ranking in the top 10 across each risk category are located in England, with none in Wales.
Our findings identified Harrow (HA) as the riskiest postcode in England and Wales, followed by Slough (SL). Meanwhile, Bromley and Ilford appeared across the most risk categories, each ranking in the top 10 for five out of the eight assessed categories.
Interestingly, all the areas featured in the top 10 riskiest postcodes for all risks combined are in Greater London or within the commuter belt.
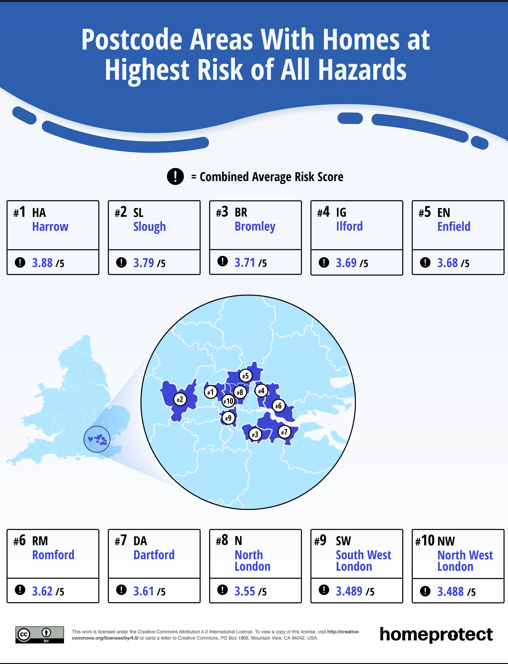
Despite these findings, property sales in these areas since 2023 have totalled over 10,000 homes in Harrow, while Slough has more than 12,000, and there have been more than 11,000 in Bromley and over 7,000 in Ilford in the past three years (according to Land Registry data).
These areas aren’t particularly cheap either, with average property values ranging from £400,000 to nearly £1 million, which is significantly above the national average house price in England.
Since 2023, Brits have purchased 153,619 properties in the top 10 riskiest postcodes, with a staggering combined spend that exceeds £105 billion.
South West and North West London account for almost half of this total (£46 billion), with the highest average property values on the list, both just shy of £1 million. In Harrow alone, over £6 billion has been spent on homes in the past three years. This suggests that, even in higher-value postcodes, UK homebuyers may either be unaware of the risks affecting their property, or are willing to proceed with the sale regardless – potentially relying on insurance or other protection for peace of mind.
According to a 2026 survey by Homeprotect, 24% of homeowners living in Greater London did not check for risks prior to exchanging contracts, while 13% don’t know what the biggest risk to their home is. Furthermore, 23% of respondents believe their home isn’t at risk from anything.
How many homebuyers check for risks?
Our survey of 1,000 UK homeowners found that, nationwide, 25% of buyers did not check for risks before exchanging contracts on their property, for example through a survey or checking local authority search results. This pattern was consistent across all age groups, but slightly more common for homeowners aged 55+, where 30% confessed they made no checks. Regionally, those in the North East (33%) are most likely to skip risk checks, followed by South East, West and East Midlands (25%), the South West and Greater London (24%).
Some buyers carry out formal checks through property surveys. Around 20% of the Brits surveyed opted for a RICS Level 2 Home Survey, offering a detailed overview of potential issues. A further 18% use a RICS Level 3 Home Survey, which provides a more comprehensive structural assessment, or rely on the mortgage valuation to flag any issues, while others rely on basic checks via the estate agent, local authority searches, or an RICS Level 1 Survey.
Our survey also revealed less common approaches, such as research through online news reports (6%), asking the seller (8%), and using online postcode risk calculators (11%).
Want to know more about the risks in your area?
Risk calculators are a quick and accessible way to identify potential risks in your area, yet only just over 1 in 10 UK homebuyers surveyed used them prior to exchanging contracts.
The Homeprotect risk calculator is a free took which flags risks in your postcode, rating each from very low to very high, along with practical tips to help you prevent or minimise damage to your home.
The highest risk areas for each risk
Riskiest postcode areas for fire
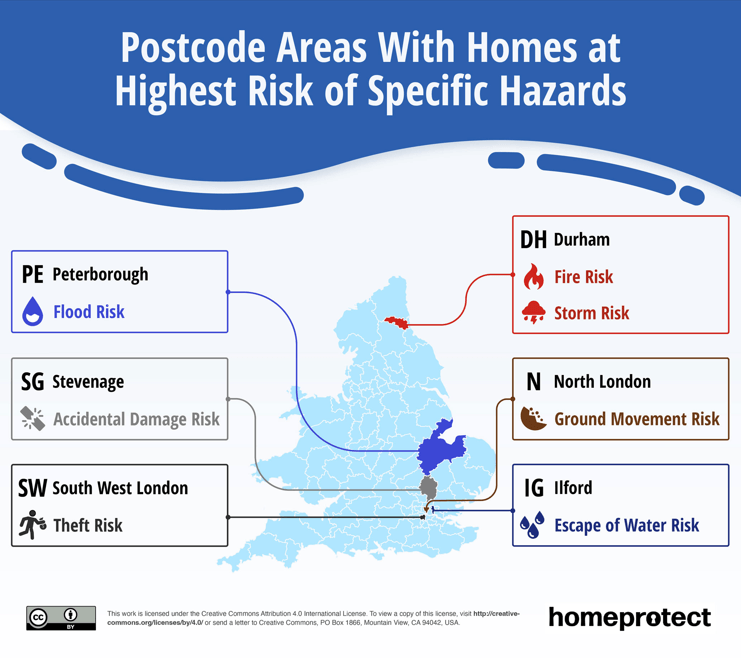
Our risk calculator found Durham as the postcode most at risk from fire, with a score of 3.10. Tunbridge Wells (3.07) and Ipswich (3) ranked second and third, respectively.
The top 10 postcodes most at risk of fire record the lowest average scores across all risk categories. Durham’s fire-risk score is below the top-ranked postcode in every other category and even below the areas ranked 10th in each, except for accidental damage. This indicates that fire risk is generally less prominent in the UK compared with other types of risk, although home fires can cause very serious damage so it’s worth getting clued up on the common causes and ways to prevent a home fire and reduce the risk, which you’ll find in our home fire risk guide.
Factors such as older properties with timber frames, outdated electrical systems, and open fireplaces or wood burners can also contribute to a home’s fire risk score.
In total, 199,241 properties were sold in the top 10 fire-risk areas since 2023. Approximately £2 billion was spent on properties in Durham, compared with over £15 billion spent in Tunbridge Wells and over £8 billion spent in Ipswich.
Riskiest postcode areas for escape of water
The Ilford area is the postcode most at risk of escape of water in England and Wales, with a score of 4.06. Harrow – identified as the UK’s overall riskiest postcode – shares second place with Bromley, both scoring 3.93.
Over the past three years, 7,610 properties have been sold in Ilford, totalling more than £4 billion. Across the top 10 postcodes exposed to this risk, 158,003 homes have been sold, with a combined spend of over £80 billion.
Within this group, Reading and Guildford account for the highest number of property purchases, with over 64,000 homes purchased between them, contributing £32 billion to the total spend in this risk group.
Risk of escape of water can vary by area depending on factors such as the age and condition of properties, which can influence the likelihood of burst pipes.
Riskiest postcode areas for accidental damage
Accidental damage is an optional extra on home or contents insurance, covering unexpected instances, such as accidentally putting a foot through your ceiling while in the loft, drilling into a hidden wall cable, or spilling paint on your carpet.
While accidental damage can happen in any home at any time, Stevenage is the riskiest postcode for things going wrong in the home, with a score of 3.46, closely followed by Chelmsford (3.43) and Romford (3.35).
Since 2023, 160,806 properties have been purchased in these areas at risk of accidental damage, with 17,725 homes sold in Stevenage alone. Around £7 billion has been spent on property in the Stevenage postcode.
Riskiest postcode areas for flooding
Over £91 billion has been spent on homes in high flood-risk areas since 2023, with 271,808 properties being sold – more than any other top 10 risk category.
Four of the top ten postcodes with high flood risk are located in the Midlands: Peterborough, Nottingham, Lincoln, and Leicester. Peterborough is the postcode most at risk, with a score of 3.81. Despite this, over 40,000 properties have been sold there since 2023, with a total spend of £11 billion.
Nottingham ranks second with a score of 3.69 and recording over £12 billion spent on 46,947 homes in the last three years.
Riskiest postcode areas for ground movement
Risk of ground movement encompasses issues like subsidence, landslips and heave. Homes in high-risk areas might require underpinning for extra structural support.
All ten of the highest-risk areas for ground movement are located within central and Greater London. Our risk calculator found North London as the postcode area most at risk, with an alarming score of 4.69. Despite this, 21,389 houses were purchased in this area in recent years, totalling over £15 billion in spend.
168,357 homes have been sold across these high-risk areas since 2023.
Riskiest postcode areas for storm risk
Durham is the postcode area most vulnerable to both fire and storms, with a storm risk score of 3.87.
The 10 highest-scoring postcodes for storm risk are all located in the North of England.
Since 2023, over £37 billion has been spent on 182,534 properties in these areas. They also have the lowest average property value of those in any other risk category, at £202,322.
Newcastle is the location with the most properties purchased (47,544), resulting in a total spend of £10 billion. Teeside ranks second, with more than £4 billion spent across 24,529 homes sold.
Riskiest postcode areas for theft
Nine of the ten postcodes at the greatest risk of theft are located in central and Greater London. In 2024/25, the police recorded over 100,000 theft from person offences in the capital.
217,625 properties were purchased across these ten areas since 2023, costing an estimated £141 billion overall.
South West London ranks as the highest-risk area for theft, with a score of 4.87 out of 5 – the highest across all risk groups. Since 2023, over 35,000 properties have been sold in this postcode, with an average house value of £975,805, totalling £34 billion in spend in South West London alone.
What do homeowners believe poses the biggest risk to their home?
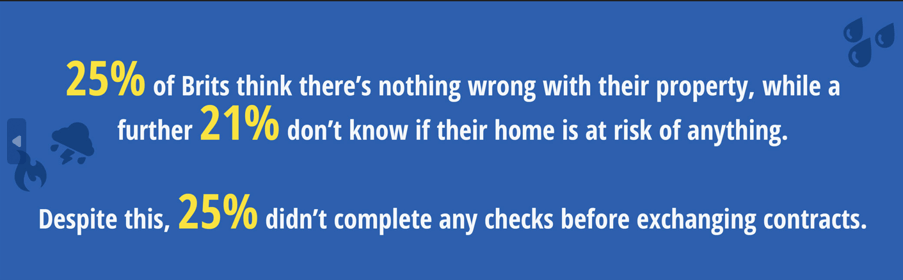
Our 2026 survey found that 25% of Brits don’t believe their home is at risk from anything, while a further 21% simply don’t know what the biggest risk to their property is.
Government research suggests that by 2050, 25% of homes will be at risk of flooding alone. A separate 2019 survey also found that over 50% of homeowners have experienced some form of water damage.
When asked about perceived risks, 15% of our survey respondents identified storm damage as the biggest threat to their property, followed by 11% who believe theft is their greatest risk. In 2024/25, police recorded around 1.78 million theft offences and over 245,000 burglaries in the UK.
Fire is considered the biggest risk by 8% of homeowners. In the year ending March 2025, the government recorded over 25,000 dwelling fires.
While only 7% of the UK say flooding is the biggest risk to their home, around 6.3 million homes in England are at risk of flooding, with this potentially reaching 8 million by 2050.
Protect your at-risk home with Homeprotect insurance
Buying a higher-risk property could make it more difficult to secure home insurance.
Some insurance providers may be more cautious and, in certain cases, decline to cover the property depending on the perceived risk.
Homeprotect specialises in non-standard properties, including those which are left unoccupied, in flood risk areas, or that have had previous issues such as subsidence – we can quote for more than 95%* of UK properties with our specialist home insurance.
Methodology
We used proprietary Homeprotect insurance risk data for the assessed risks for each postcode region, and ranked them accordingly.
Homeprotect’s original research gives each postcode area a score out of five for different risks, including flood, fire, ground movement, etc.
We took the average of all the district and sector postcodes for each main postcode area to establish our scores.
Overall riskiest postcodes were based off the average of a separate ‘weighted average’ data point from the districts and sectors within each main postcode area. This is because some home insurance risks are more serious than others.
We then used HM Land Registry data to calculate the number of properties sold from January 2023 to February 2026 in each postcode area.
We used this Land Registry webpage to gather the data for English and Welsh postcode areas that made it into the top 10 for any of our risk categories.
We excluded Scotland, Northern Ireland, the Channel Islands, and the Isle of Man to keep property sales data comparable.
Finally, to discover how many homeowners are taking appropriate precautions when purchasing a property, Censuswide conducted a survey on our behalf in April 2026 of 1,000 UK homeowners.
We asked the following questions:
- Before exchanging contracts, how, if at all, did you check whether the property was in an area with elevated exposure to environmental or structural risks (such as flood, ground movement/subsidence, storm damage, fire or escape of water)?
- What do you believe poses the biggest risk to your home in the future?